



Most product teams track requirements metrics wrong. They count completed stories, measure velocity, track defect rates — while the actual operational reality gets worse. Engineering complains requirements are unclear, product keeps changing priorities mid-sprint, and stakeholders wonder why features miss the mark despite those green dashboards.
The disconnect happens because teams track activity metrics instead of operational ones. They measure how many requirements got written, not whether those requirements actually helped ship the right thing. They track defect counts without connecting them to requirement quality. They celebrate high velocity while rework rates climb in the background.
After building requirements tracking systems for dozens of product teams, the pattern becomes clear. Teams that succeed don't just measure more — they measure differently. They track metrics that expose operational problems before they compound. They wire their tools to surface coordination breakdowns, not just completion rates.
The operational reality most teams ignore
Requirements work differently at 10 features versus 100 features versus 1000 features. What starts as a documentation problem becomes a coordination problem, then a knowledge management problem, then eventually a full operational breakdown.
Small teams can survive with bad requirements metrics because everyone talks to everyone. The product manager sits next to the developers. Clarifications happen over coffee. Context fills the gaps that documentation misses.
Around 15-20 people, that informal coordination starts breaking. The product manager can't answer every question personally. Developers start making assumptions. QA finds issues that should have been caught during requirements review. Support gets tickets about features that don't work like customers expected.
Most teams respond by adding more process. More detailed requirements templates. Longer review cycles. Additional sign-offs. The metrics look better — requirements are more "complete" according to the checklist — but delivery actually gets worse. The requirements might be longer, but they're not clearer. The review process catches formatting issues, not conceptual gaps.
It's not a documentation problem. It's operational visibility. Teams need metrics that show when requirements aren't flowing effectively through their system, not just whether boxes got checked.
Metric 1: Requirements Change Rate After Development Start
Formula: (Requirements modified after dev start / Total requirements in sprint) × 100
Stop losing track of critical project requirements.
GoReqly helps you capture, organize, and track every requirement with precision and clarity.
- Centralized requirements repository
- Collaborative editing & commenting
- Traceability & version control
No credit card required
This metric exposes how often your team discovers requirement gaps after work begins. High rates indicate upstream problems — either insufficient discovery, poor stakeholder alignment, or rushed planning.
Data sources:
-
Jira
Track field changes on stories after sprint start
-
Azure DevOps
Use work item revisions API
-
Requirements tools
Monitor approval timestamp versus development start
Dashboard setup: Track this as a rolling 4-sprint average. Single sprints can spike for valid reasons (market changes, customer feedback), but sustained high rates signal systematic problems.
Warning threshold: Above 25% means your requirements process needs fundamental changes, not just better templates.
Most teams discover this runs 40-60% when they first measure it. They assume some changes are normal, but that assumption hides massive inefficiency. Every mid-sprint requirement change triggers cascading updates — code changes, test updates, documentation revisions. A 40% change rate means nearly half your sprint capacity gets disrupted.
Metric 2: Clarification Request Density
Formula: (Clarification comments + questions) / Total requirements per sprint
This tracks how often developers need additional context beyond the written requirements. It directly correlates with delivery speed and defect rates.
Data sources:
-
Comments on Jira tickets filtered by question marks or keywords like "unclear," "which," "should this"
-
Slack threads linked to requirements
-
Meeting notes referencing requirement discussions
Dashboard setup: Create a heatmap showing which requirement types generate the most clarifications. API requirements often spike higher than UI requirements, indicating where your templates fail.
Target range: 0.5-1.5 clarifications per requirement is healthy. Below 0.5 might mean developers are making assumptions instead of asking. Above 2.0 means requirements lack essential details.
Metric 3: Requirement Dependency Chain Length
Formula: Average number of connected requirements per feature
This shows how interconnected your requirements have become. Longer chains mean higher coordination overhead and increased risk of cascade failures.
Data sources:
-
Link analysis in Jira (blocks/blocked by relationships)
-
Epic to story to subtask depth
-
Cross-team requirement references
Dashboard setup: Visualize as a network diagram updated weekly. When you see spider webs forming instead of clean hierarchies, your architecture is coupling too tightly.
Danger zone: Chains longer than 4 levels deep. At this point, changing one requirement ripples through so many others that teams spend more time coordinating than building.
One fintech team discovered their average chain length had grown to 7 levels deep. Every feature touched payment processing, compliance rules, reporting systems, and multiple UI components. They spent 3 sprints just mapping dependencies before they could even estimate new work.
Metric 4: Requirements Realization Rate
Formula: (Features delivered as specified / Total features attempted) × 100
Whether what gets built matches what was specified. Low rates indicate translation problems between requirements and implementation.
Data sources:
-
User acceptance test results
-
Production verification outcomes
-
Customer support tickets within 30 days of release
Dashboard setup: Track by requirement author and by development team. Patterns often emerge showing specific handoff points where translation fails.
Excellence threshold: 85% or higher. Below 70% means requirements aren't actionable enough for consistent implementation.
Metric 5: Cross-Functional Touch Time
Formula: Sum of time each role spends on a requirement before approval
How much collective effort goes into requirement preparation versus actual building. High touch time often indicates unclear ownership or excessive consensus-seeking.
Data sources:
-
Time tracking by role (if available)
-
State transition timestamps in workflow tools
-
Calendar analysis of requirement review meetings
Dashboard setup: Stack chart showing time by role. If product, design, and engineering each spend 4+ hours on every requirement, you're over-processing.
Efficiency target: Total touch time should be less than 25% of development time. If a feature takes 40 hours to build, requirement prep shouldn't exceed 10 hours across all roles.
Metric 6: Orphaned Requirement Rate
Formula: (Requirements with no traceable outcome / Total requirements created) × 100
How many requirements get written but never implemented, tested, or explicitly rejected. High rates indicate planning waste or priority thrash.
Data sources:
-
Requirements without linked code commits
-
Stories without test cases
-
Aged items in backlog (>6 months untouched)
Dashboard setup: Monthly cleanup report showing orphaned requirements by age and author. Patterns reveal which initiatives consistently over-specify or which teams abandon work mid-flight.
Acceptable range: 10-15% orphan rate is normal. Above 30% means you're writing requirements for work that never happens.
Metric 7: Requirements Traceability Coverage
Formula: (Requirements with complete upstream and downstream links / Total requirements) × 100
Whether you can trace from business objective to requirement to code to test. Low coverage means you can't prove features deliver intended value.
Data sources:
-
Business case to epic links
-
Epic to story decomposition
-
Story to pull request links
-
Story to test case mappings
Dashboard setup: Traceability matrix refreshed during each retrospective. Gaps show where documentation or tooling breaks down.
Minimum viable coverage: 60% for regulated industries, 40% for others. Below this, you can't answer "why did we build this?" six months later.
Metric 8: Requirement Aging Velocity
Formula: Average days from requirement creation to implementation start
How long requirements sit before development begins. Long aging indicates either over-planning or priority misalignment.
Data sources:
-
Creation date to sprint assignment gap
-
Backlog aging reports
-
Requirement approval to development start timestamps
Dashboard setup: Histogram showing distribution of aging by requirement priority. High-priority items aging more than 30 days signal planning dysfunction.
Healthy range: P1 requirements: <14 days, P2: <30 days, P3: <60 days. Beyond these windows, requirements often need complete rewriting due to context changes.
Wiring these metrics into your operational flow
The metrics mean nothing if they sit in spreadsheets updated quarterly. They need to flow through your daily operations, surfacing problems while you can still fix them.
Start with your existing tools. If you use Jira, create automation rules that flag requirements when clarification density exceeds 2.0. Set up webhooks that alert when dependency chains exceed 4 levels. Build dashboards that update in real-time, not monthly reports that arrive too late.
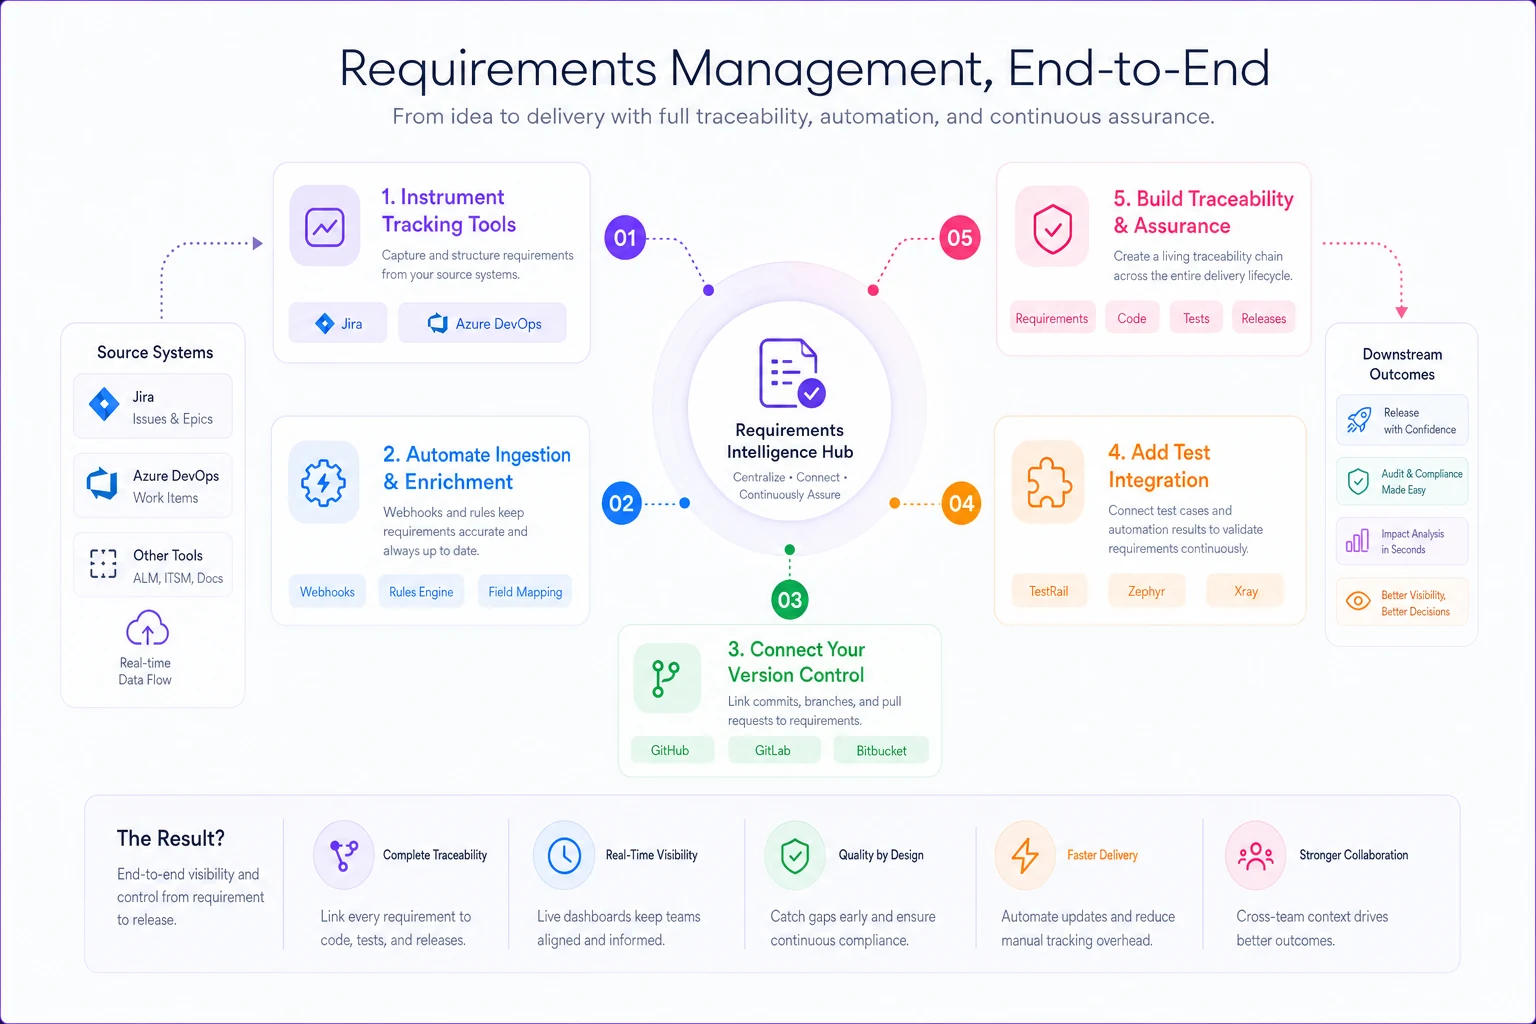
For teams using Azure DevOps, leverage the Analytics service to track requirement changes. Create queries that identify orphaned requirements weekly. Set up build pipelines that verify traceability before allowing deployment.
-
Week 1-2 Instrument your requirements tool to capture the raw data. Add custom fields for tracking clarifications. Enable revision history. Set up basic webhooks.
-
Week 3-4 Create your first dashboard focusing on just 2-3 metrics. Start with Change Rate and Clarification Density — these give immediate value.
-
Week 5-6 Connect your version control system. Every pull request needs a requirement link. Reject PRs that don't reference valid requirements.
-
Week 7-8 Add test management integration. Test cases must reference requirements. Failed tests should automatically flag the associated requirement for review.
-
Week 9-12 Build the full traceability chain. From business case to requirement to code to test to deployment. Yes, it takes this long to do properly.
Most teams try to implement all eight metrics simultaneously and fail. Start with the ones that address your biggest pain. If development constantly asks for clarification, begin with Clarification Density. If priorities shift mid-sprint, focus on Change Rate first.
The connection to CI/CD tools matters more than most teams realize. Every code commit should link to a requirement. Every test run should trace back to acceptance criteria. Every deployment should map to business objectives. Without these connections, you're flying blind.
The operational patterns that emerge
After tracking these metrics across dozens of teams, clear patterns emerge about what actually drives requirement quality.
Teams with low clarification density don't write better requirements initially. They have better feedback loops. Developers flag unclear requirements during grooming, not after sprint start. Product managers join technical discussions early. The requirements improve through rapid iteration, not perfect first drafts.
Organizations with short dependency chains didn't start that way. They actively refactored their requirement structure when chains grew too long. They broke apart monolithic features. They created clear interface definitions between components. The metrics showed them where coupling hurt most.
High-performing teams keep requirement aging under 21 days for 80% of their work. They achieve this by writing requirements just-in-time, not months in advance. They maintain a thin layer of ready work, not massive backlogs that grow stale.
When these metrics actually help versus hurt
These metrics work well for teams building products with evolving requirements. SaaS products, mobile apps, internal platforms — anywhere requirements change based on user feedback and market conditions.
They work poorly for waterfall contracts with fixed requirements. If you're building to a specification that can't change, tracking change rate just frustrates everyone. Focus on traceability and realization rate instead.
Teams under 8 people rarely benefit from this level of measurement. The overhead exceeds the value. Keep using lightweight approaches until coordination pain justifies systematic tracking.
Heavily regulated industries need all eight metrics plus additional compliance-specific ones. Medical devices, financial services, aerospace — these domains require proving requirement traceability for audits. The metrics become operational necessities, not just optimization tools.
Making the metrics drive actual change
Metrics without action just create busywork. Each metric needs clear response triggers that fix problems while they're small.
| Metric | Threshold / Notes |
|---|---|
| Change Rate | Above 25% means your requirements process needs fundamental changes, not just better templates. |
| Clarification Density | Target range: 0.5-1.5 clarifications per requirement; Above 2.0 means requirements lack essential details. |
| Dependency Chain Length | Danger zone: Chains longer than 4 levels deep. |
| Realization Rate | Excellence threshold: 85% or higher. Below 70% is problematic. |
| Cross-Functional Touch Time | Efficiency target: Total touch time should be less than 25% of development time. |
| Orphaned Requirement Rate | Acceptable range: 10-15% normal. Above 30% indicates waste. |
| Traceability Coverage | Minimum viable coverage: 60% for regulated industries, 40% for others. |
| Requirement Aging Velocity | Healthy range: P1 <14 days, P2 <30 days, P3 <60 days. |
When Change Rate exceeds 25%:
-
Implement requirement freeze periods before sprint start
-
Add stakeholder sign-off requirements
-
Increase discovery sprint allocation
When Clarification Density exceeds 2.0:
-
Schedule requirement workshop sessions
-
Create example-driven templates
-
Pair product managers with developers during writing
When Dependency Chains exceed 4 levels:
-
Trigger architectural review
-
Break features into smaller increments
-
Create interface contracts between components
When Realization Rate drops below 70%:
-
Add acceptance criteria verification before development
-
Implement definition of done checklists
-
Increase user acceptance testing
The response can't just be "write better requirements." That's like telling someone to "communicate better" — true but useless. The metrics should trigger specific operational changes that address root causes.
The tools and integration reality
Most teams cobble together requirements tracking from whatever tools they already have. Jira for work tracking, Confluence for documentation, Git for code, TestRail for testing. The challenge becomes connecting these systems to calculate metrics automatically.
If you're starting fresh, modern requirements platforms with built-in AI automation handle much of this integration automatically. They track clarifications through natural language processing, identify dependency chains through reference analysis, and calculate metrics in real-time. But most teams aren't starting fresh.
For Jira-based teams, JQL queries can extract most of the raw data:
-
Change Rate
project = X AND sprint = Y AND (history.field = "description" OR history.field = "acceptance criteria") AND history.date > sprint.startDate -
Clarification Density
project = X AND comments > 0 AND comment.text ~ "?" -
Dependency tracking
Analyze issue links with type "blocks"
Azure DevOps teams can use Analytics views and Power BI integration for similar tracking. The Work Item query API provides historical data for change analysis.
For teams using modern CI/CD pipelines, integrate requirement verification into your build process. GitLab, GitHub Actions, and Jenkins all support plugins that verify commit linkage to requirements. This automation ensures traceability without manual overhead.
The wiring investment typically takes 2-3 sprints to implement properly. But once running, these metrics become part of your operational rhythm. They surface problems before they cascade, identify improvement opportunities, and prove when changes actually work.
Building requirements operations that scale
The best product teams treat requirements like code — version controlled, tested, refactored, and continuously improved. They don't just write requirements; they operate a requirements system.
This operational approach means tracking metrics that matter, wiring tools that automate measurement, and responding to signals before problems compound. It means accepting that requirements quality isn't about perfect documentation but effective coordination.
The eight metrics outlined here won't fix broken requirements overnight. But they'll show you exactly where your requirements process breaks down, how severely, and what to fix first. They transform requirements from a documentation exercise into an operational capability.
Start with one metric. Wire it properly. Act on what it reveals. Then add another. Within a quarter, you'll have visibility into requirements operations that most teams never achieve. Within six months, you'll wonder how you ever operated without it.
The goal isn't perfect requirements. It's requirements that drive successful delivery. These metrics, properly wired and actively managed, make that achievable even as your product and team scale.
Ready to transform your product delivery?
Join 2,000+ teams using GoReqly to improve requirements accuracy, reduce rework, and accelerate time to market.